The amount of money spent on special education students in Washington varies widely by district.
That’s according to a new analysis of state data from July 2022 to June 2023 of Washington districts where there are over 2,500 students. According to the data, the amount each district spends per special education student ranges from $8,708 in Goldendale School District to $33,056 in Bellevue School District.
“Historically, our tendency is to look the other way on special education spending,” said Marguerite Roza, director of Edunomics Lab at Georgetown University, which created the analysis. “It hasn’t gotten the same kind of scrutiny that other elements in the school district budget have.”
Support non-profit journalism
This article has been reposted with permission from the Washington State Standard under Creative Commons license CC BY-NC-ND 4.0. The Standard is part of States Newsroom, the nation’s largest state-focused nonprofit news organization and committed to shining "a light on policy and politics in all 50 states." Click here to support nonprofit, freely distributed, independent local journalism. Read this article and others online at Washington State Standard.
How much does your district spend on special education?
Spending per special education student varies widely by district in Washington and across the country. Special education is also consuming a rising share of Washington’s public education budget, now making up over 14.5% of that spending as of the most recent fiscal year, according to the Edunomics Lab analysis. That can force cuts elsewhere, Roza said.
Amount per student spending on special education services
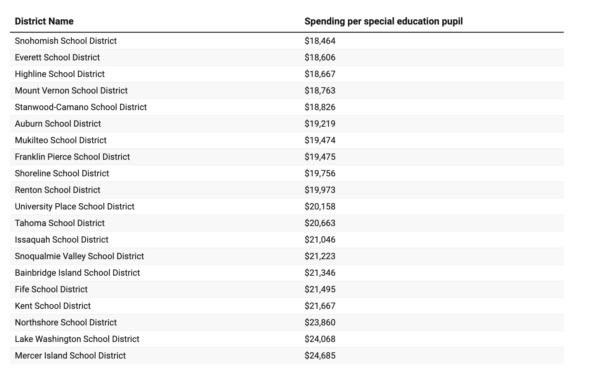
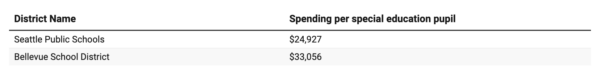
Data only includes districts with 2,500 students or more. Table: Grace DengSource: Edunomics Lab/Office of Superintendent of Public Instruction. Created with Datawrapper
Washington has steadily increased its cap on the percentage of a district’s population that can receive special education funding. Some lawmakers and advocates have pushed for the Legislature to end the cap entirely, as many districts have identified more special education students than they’re funded for.
Both candidates running for superintendent of public instruction are also calling for more special education spending.
But there are concerns about how eliminating the cap could raise overall state spending. Legislators who have resisted the idea have said it would require scaling back in other areas.
Does spending mean success
More spending on special education doesn’t necessarily mean better academic outcomes for students, said Roza. That’s based on state-by-state comparisons by Edunomics Lab, which found that identifying more students with disabilities or increasing special education staff were not associated with better reading outcomes.
That’s noteworthy because the most common special education diagnosis, specific learning disabilities, includes children who are dyslexic or have other neurological differences that interfere with their ability to process language.
More spending on special education per student doesn’t directly correlate with the number of special education students in a district, either. Instead, more spending on special education often tracks with district size, likely because larger districts use a standardized approach to serving special education students, Roza said.

The Edunomics Lab analysis found that instead of spending on special education specifically, what improved reading outcomes for students with disabilities was spending more on reading instruction for all students, regardless of disability.
To ensure districts are getting the most out of their money, the lab’s researchers recommend districts scrutinize their special education budgets and compare their costs and outcomes to their peers.
 Special education spending compared to 4th grade students with disabilities’ English Language Arts scores. (Edunomics Lab)
Read more:
Capital gains tax repeal could cost WA public schools billions